Viewing process and object details at runtime through trace output statements is a valuable tool for any software developer. In .NET, Trace statements are great because their publish/subscribe model allows them to be left in released code with very little impact to performance when no listeners are attached. Down the road when a problem pops up in production, an administrator can turn on the appropriate trace listener and receive debug information to help troubleshoot.
Victor Vogelpoel of Macaw has released a free SharePoint WebPart that allows SharePoint developers to use System.Diagnostics.Trace statements in only a few simple steps.
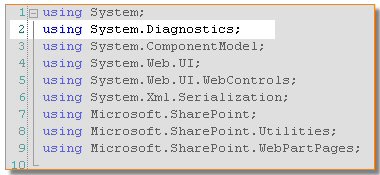
Just add the System.Diagnotics namespace to your Web Part class,
and display trace output with the Trace.WriteLine statement.
The resulting trace output will be "captured" by Macaw's TraceInfo WebPart.
That's it!
The TraceInfo WebPart also has the ability to filter based on trace category:
The TraceInfo WebPart can be downloaded from Victor's blog.


No comments:
Post a Comment